Chi-Squared Distribution
If  have normal independent distributions with mean 0 and variance 1, then
| (1) |
is distributed as  with
with  degrees of freedom. This makes a
  distribution a gamma distribution with
  and
and  , where
  is the number of degrees of freedom.
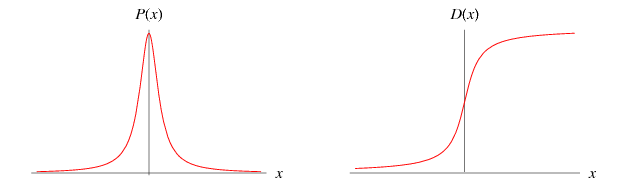
Probability density function |
A continuous statistical distribution which arises in the testing of whether two observed samples have the same variance. Let  and
and  be independent variates distributed as chi-squared with
  and
and  degrees of freedom.
Define a statistic  as the ratio of the dispersions of the two distributions
Probability density function |
A statistical distribution published by William Gosset in 1908. His employer, Guinness Breweries, required him to publish under a pseudonym, so he chose "Student." Given  independent measurements
  , let
, let
| (1) |
where  is the population mean,
  is the sample mean, and
  is the estimator for population standard deviation (i.e., the sample variance) defined by
| (2) |
Student's  -distribution is defined as the distribution of the random variable
  which is (very loosely) the "best" that we can do not knowing
  .
.
The relation of F to t
Since the F test is just an extension of the t test to more than two groups, they should be related and they are. With two group, F=t^2. For example, consider the critical values for df=(1,15) with alpha=0.05: F(1,15)=4.54=t(15)^2
The relation of T to Gaussian Distr.
The t density curves are symmetric and bell-shaped like the normal distribution and have their peak at 0. However, the spread is more than that of the standard normal distribution. This is due to the fact that in formula 1, the denominator is s rather than ![]() . Since s is a random quantity varying with various samples, the variability in t is more, resulting in a larger spread.
. Since s is a random quantity varying with various samples, the variability in t is more, resulting in a larger spread.
The larger the degrees of freedom, the closer the t-density is to the normal density. This reflects the fact that the standard deviation s approaches ![]() for large sample size n. You can visualize this in the applet below by moving the sliders.
for large sample size n. You can visualize this in the applet below by moving the sliders.
The stationary curve is the standard normal density.

No comments:
Post a Comment