In statistics, the correlation ratio is a measure of the relationship between the statistical dispersion within individual categories and the dispersion across the whole population or sample.
Suppose each observation is yxi where x indicates the category that observation is in and i is the label of the particular observation. We will write nx for the number of observations in category x (not necessarily the same for different values of x) and
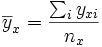 and
and 
then the correlation ratio η (eta) is defined so as to satisfy

which might be written as

It is worth noting that if the relationship between values of  and values of
  is linear (which is certainly true when there are only two possibilities for x) this will give the same result as the square of the correlation coefficient; if not then the correlation ratio will be larger in magnitude, though still no more than 1 in magnitude. It can therefore be used for judging non-linear relationships.

No comments:
Post a Comment